What is Confidence Intervals?
Confidence intervals are used to learn how much uncertainity there is for a parameter.It is an estimate of the interval between values. To do this estimations there are some concepts to learn first.
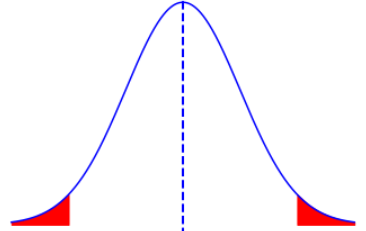
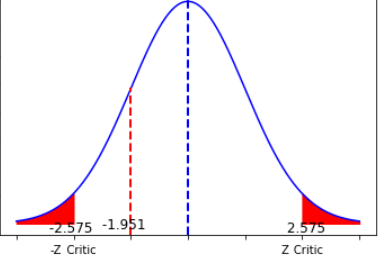
Confidence level(1-α):The level of certainity that the range estimate includes the population parameter.For example we can say %95 or %99 etc.
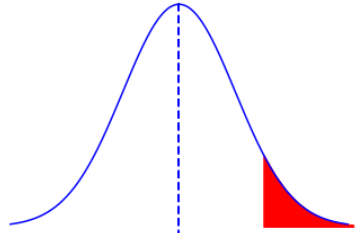
Significance level(α):The probability that the true value is outside the estimate range.FOr example the most commonly used is 0.05 and that equals %95 confidence level.
Error margin(e):It is the largest possible distance from the estimate covered by the confidence interval.For population mean interval calculation is x̄-e < μ < x̄+e
To calculate error(e) we will see three concepts in this section.
If;
n= number of data in chosen sample
x̄= sample mean
μ(mu)= population mean
α(alpha)= significance level
σ(sigma)= standard deviation for population
s= standard deviation for chosen sample
There are 3 formulas of error(e) for 3 seperate situations we will see in this section:
First situation; population mean interval calculation for known population variance.We will do the calculations with Z-table.
Second situation; population mean interval calculation for unknwon population variance and sample size>=30.We will do the calculations with Z-table.
Third situation; population mean interval calculation for unknwon population variance and sample size<30 .We will do the calculations with t-table.
So let's start off to calculations
1-)Population mean interval for known population variance
Confidence interval formula: x̄-e < μ < x̄+e
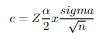
Error(e) formula= Zα/2 x σ/√n
So confidence interval formula is= x̄-(Zα/2 x σ/√n)< μ < x̄+(Zα/2 x σ/√n)
In a sample taken from a group of 20 people average time spent on social media is 5 hours per day.If the population standard deviation is 30 minutes per 5 hours, find the confidence intervals for;
a) %90 confidene level
b) %95 confidence level
Solution a) x̄-[(Zα/2)x(σ/√n)]< μ < x̄+[(Zα/2) x (σ/√n)] ==> 5-[(1.645)x(0.5/√20)] < μ < 5+[(1.645)x(0.5/√20)]
Solution b) x̄-[(Zα/2)x(σ/√n)]< μ < x̄+[(Zα/2) x (σ/√n)] ==> 5-[(1.96)x(0.5/√20)] < μ < 5+[(1.96)x(0.5/√20)]
2.1-)Population mean interval for unknown population variance and sample size(n)=>30
Confidence interval formula: x̄-e < μ < x̄+e
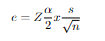
Error(e) formula= Zα/2 x s/√n
So confidence interval formula is= x̄-(Zα/2 x s/√n)< μ < x̄+(Zα/2 x s/√n)
In a sample taken from 45 person, average kilometers driven with a car daily is 50 kilometers.If the sample standard deviation is 10 kilometers, find the neighborhoods confidence interval for;
a) %90 confidene level
b) %95 confidence level
Solution a) x̄-[(Zα/2)x(s/√n)]< μ < x̄+[(Zα/2) x (s/√n)] ==> 50-[(1.645)x(10/√45)] < μ < 50+[(1.645)x(10/√45)]
Solution b) x̄-[(Zα/2)x(σ/√n)]< μ < x̄+[(Zα/2) x (σ/√n)] ==> 50-[(1.96)x(10/√45)] < μ < 50+[(1.96)x(10/√45)]
2.2-)Population mean interval for unknown population variance and sample size(n)< 30
Confidence interval formula: x̄-e < μ < x̄+e
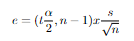
Error(e) formula= tα/2 x s/√n
For this calculation we will differ than other two by using t-statistic.I haven't show how to use t-table so you may need to look up for it in order to do the calculations on your own.
So confidence interval formula is= x̄-(tα/2 x s/√n)< μ < x̄+(tα/2 x s/√n)
In a sample taken from 10 houses in a neighborhood, yearly average income is 50k dollars.If the sample standard deviation is 5k dollars, find the neighborhoods confidence interval for;
a) %90 confidene level
b) %95 confidence level
Solution a) x̄-[(tα/2)x(s/√n)]< μ < x̄+[(tα/2) x (s/√n)] ==> 50-[(1.833)x(5/√10)] < μ < 50+[(1.833)x(5/√10)]
Solution b) x̄-[(tα/2)x(s/√n)]< μ < x̄+[(tα/2) x (s/√n)] ==> 50-[(2.262)x(5/√10)] < μ < 50+[(2.262)x(5/√10)]