Distrubitions
Binomial Distrubition
Before diving deep to Binomial distrubitions we should update our knowledge about Binomial Coefficient calculations and probability.
Binomial Distrubitions is used when there exactly two outcomes.Like flipping a coin or a students exam grade has passed or not. We know that in there are some calculations of them in probability.But how does that relation with a "distrubition"? Let's see together.
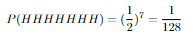
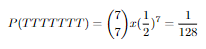
Let's say we are flipping a coin 7 times.What is the probability of there is no Tails?
We will say heads to: H and tails to: T. And number of T after 7 flips is x.
We are looking for P(x=0)=? right?
Than it is P(HHHHHHH)=?.
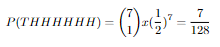
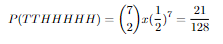
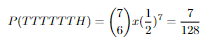
What is the probability of there is one tails?
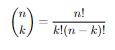
Now in the above equation we don't need any coefficient because we calculated there is no tails.The thing is we don't care about the order of the tails.It can be at the first try or the last try.So it is called combination. Binomial coefficient is the other name of combination and this is the formula.
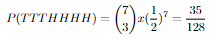
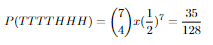
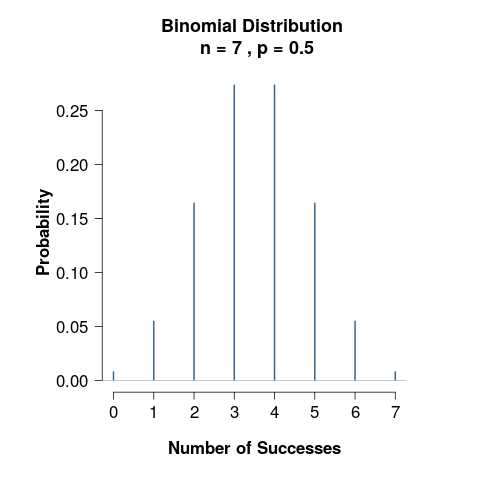
So if we calculate all the tail probabilities for 7 flips this will be it:
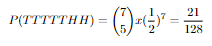
Now these are our probabilites for each 7 flips. Let's show them in a plot and make a distrubition out of this shall we?
Poisson Distrubition
Poisson distrubition is used to show the probability of a given event over a specific period.
Here is the formula:
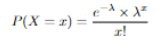
e is the eulers number=2.71828
λ is the expected value
x is the value we want to see the probability.
P(X) is the probability of x.
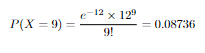
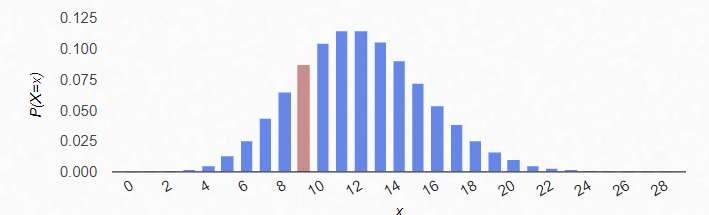
So let's say there are 12 fish on average gets caught by a boat in 2 hours.What is the probability of 9 fish caught by that person over next 2 hours?
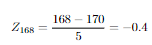
Gaussian Normal Distrubition
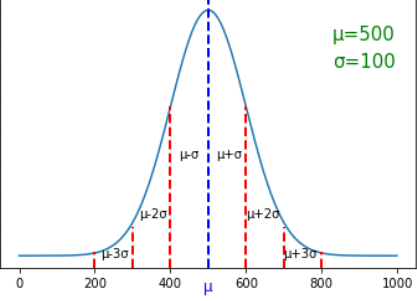
The other two distrubitions we saw were discrete distrubitions.Gaussian Distrubition is arguably one of the most important distrubitions.This is a continuous distrubition. It is one of the best fit for natural phenomenas so it is used commonly in statistics. Gaussian Distrubition is mostly described as a bell curve.And it is symmetrical from center.In the center we have the mean value and you can go to each side 3 standard deviation. So at the right wing the value is Mean+(3xStandard deviation).At the left Mean-(3xStandard deviation).We will se how to use these. Here is the formula:
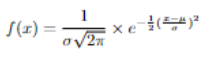
Here is the distrubition: