Measures of Variability
Range-Midrange and Box-plots
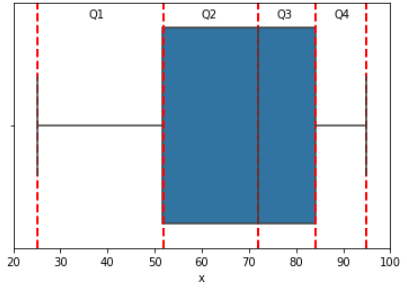
Box-plots are a very effective way to visualize the range of data.We use quantiles to describe the box-plot points. Range metric is the (Largest observation - Smallest observation).Mid-range is ((Largest observation+Smallest observation)/2).
Let's say the median of 200 students exam grade is 72 out of 100.If we know the lowest and highest grades we can visualize it in box-plot as quantiles. Let's say lowest grade is 25 and highest is 95.Let's draw a box-plot with Python's matplotlib and seaborn.
Variance and Standard Deviation
The variance is simply about highlighting some values based on their distance to the mean.
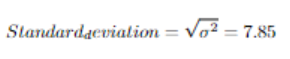
Standard deviation is about the homogenity around arithmetic mean.
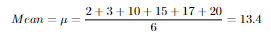
2,3,10,15,17,20
Let's calculate these around the data above.

Population-Sample Variance
There may be times that we don't know all about a populations data.That means we may have a sample data from given population that nearly enough to describe a population.
Let's say we have a population of people that play videogames daily.We have a sample of we know how many hours sample members plays daily. If we want to estimate this populations total variance, how can we estimate from sample variance?
Sample data: 0.5,2,4,5,6,6.5
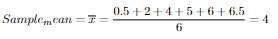


There are two ways to estimate population variance by sample variance as you see above. The reason why we should use (n-1) is because we are estimating a population metric, it can be more accurate and unbiased in most cases.