What is tabular data?
Let's say we are counting the people passing by on a road. We wonder how many blue shirted male person will pass by.
First person that passes has red shirt and a female. Second is green shirt and a male. The third one is blue shirted and a male.
We found the blue shirted male on our third try. So we've got a data already, good.Here is our dataset or we can call this tabular data.
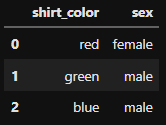
In tabular datasets we call every observation a row and every feature a column . So in this dataset we have 2 columns 3 rows.
It may have caught your attention that first row is starting with 0.That is the standard indexing.
Exploratory Data Analysis with Python libraries
Python has several robust libraries as I am about to show.
Let's start with a brand new dataset.
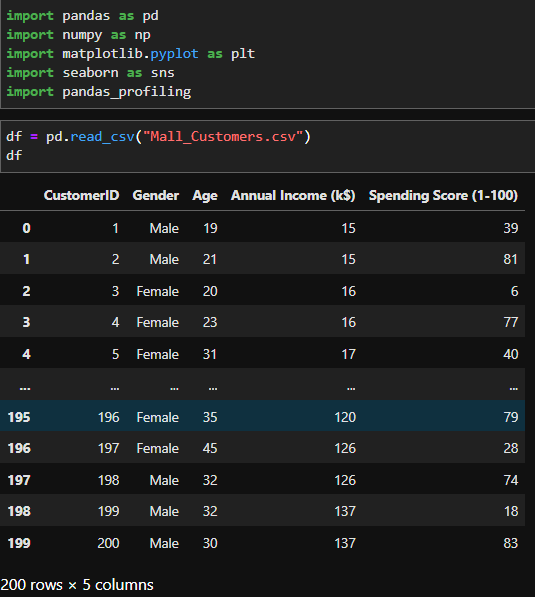
This dataset is about a mall's customer base and their spending score.
Datasets come with several formats like .csv, .xls, .sql.This dataset has .csv format.
So first we will read dataset and transform it to pandas DataFrame format
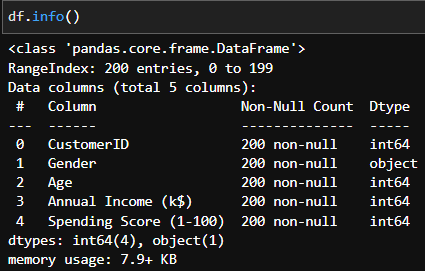
Let's see the information about columns(or features).
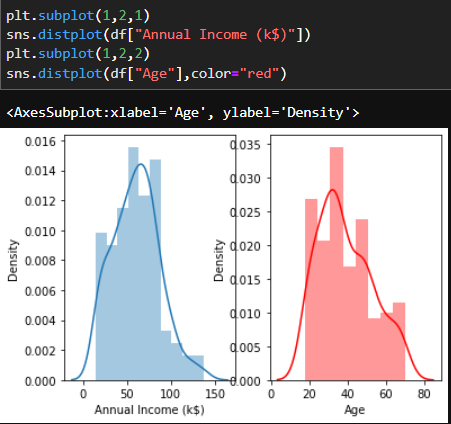
Now let's see the distrubition of Annual Income and Age columns in our dataset.
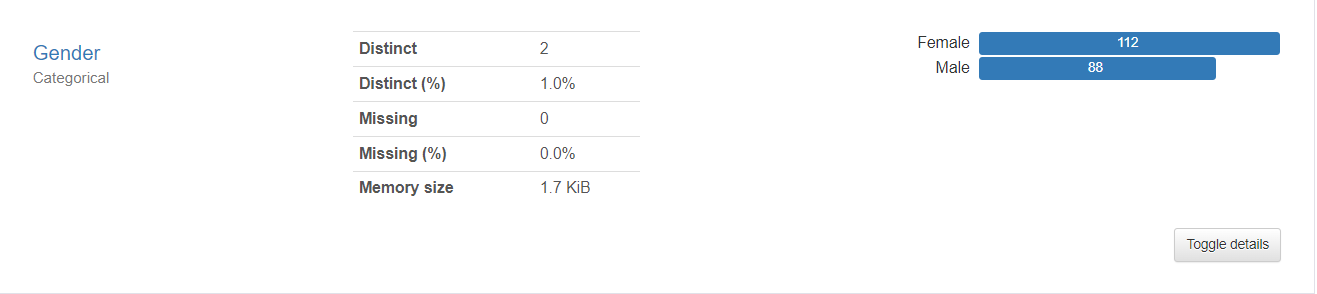
Do we want to see the ratio of Male/Female customer as a pie chart? That's fine.
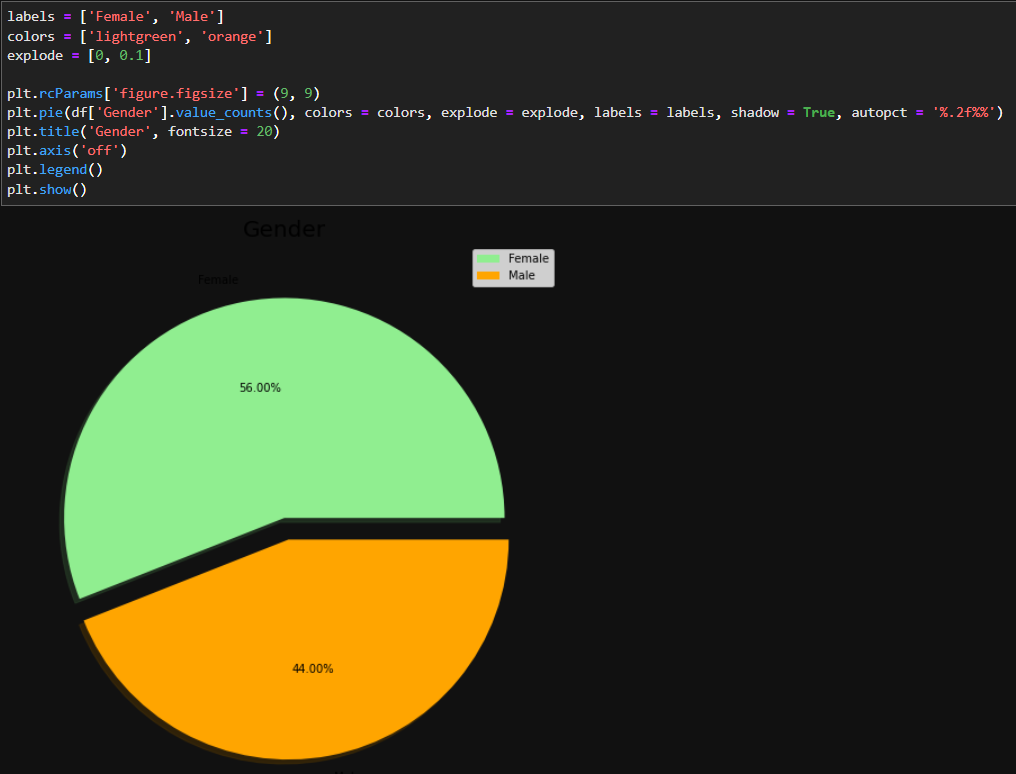
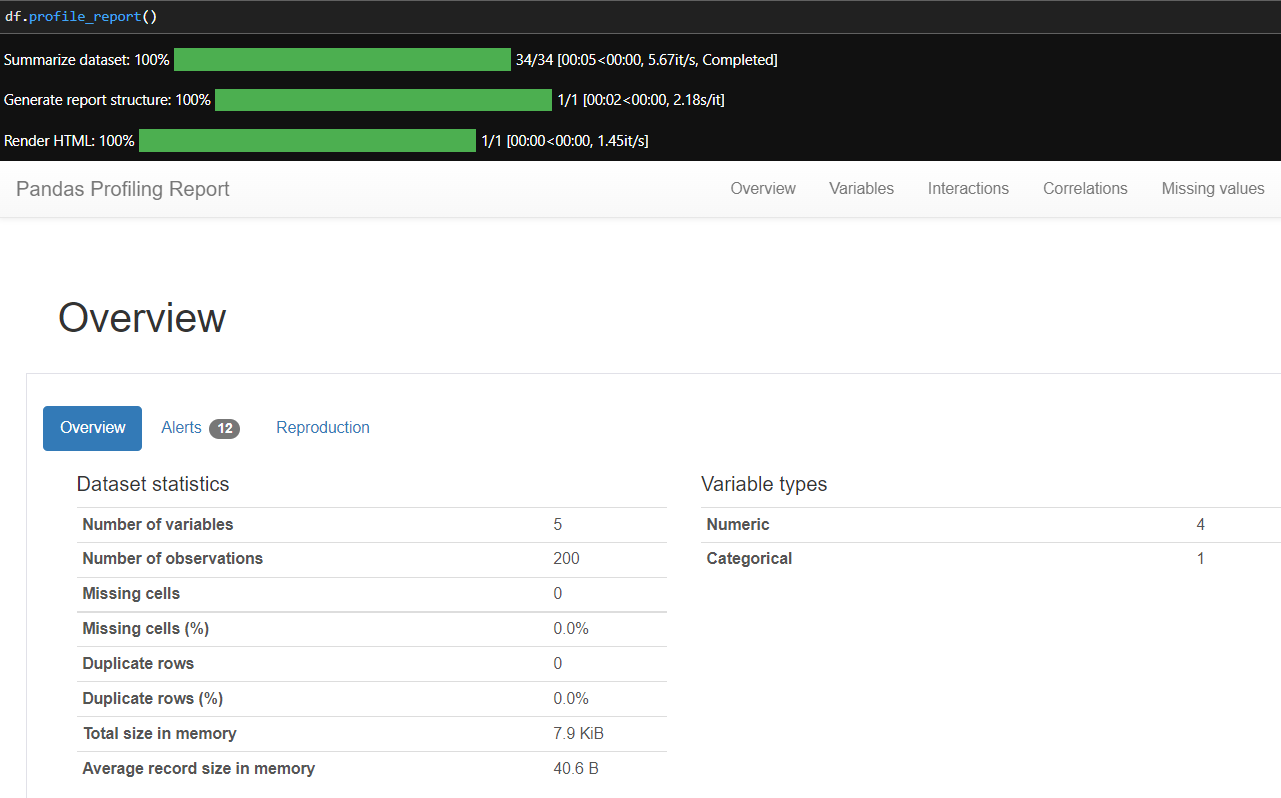
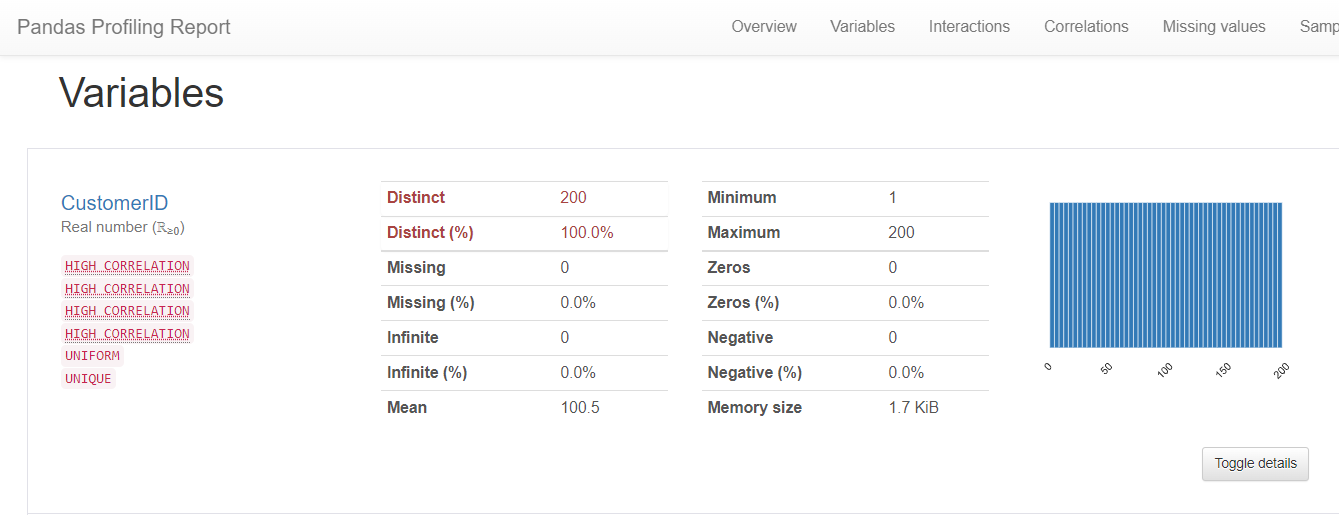
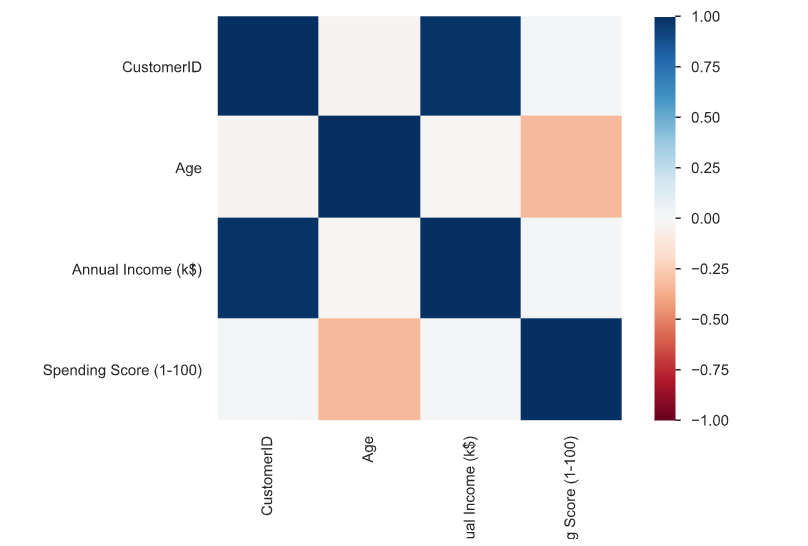
Here you see the codes above.That's not much lines of code to write.Because Python has so many open-source libraries we can see all about every column in just one line of code.The library I will use is pandas-profiling.